Last Updated on Sep 2, 2020
Xiaomi MiFlora is a cost-effective plant sensor, which uses Bluetooth Low Energy (BLE) to communicate wirelessly, and is capable of sensing temperature, soil humidity, light, soil fertility and it’s own battery level.
Daniel Matuschek (openha) and other contributors have written a library for the device, and his python code is capable of reading the sensor’s data on Linux. I have been running it on Raspbian Lite operating system, on my Raspberry Pi 3 and also have tested it on my Raspberry Pi Zero W (both devices have onboard Wifi and Bluetooth, no dongles needed).
Using pimatic as a data display dashboard
As I use pimatic for my other home automation projects, I wanted to come up with a way to display the MiFlora sensor’s data on my pimatic web interface dashboard. To date, there is no native pimatic plugin for the Miflora sensor*, but with a simple workaround of using 3 already existing pimatic plugins (pimatic-cron, pimatic-shell-execute, pimatic-log-reader) the data can be displayed in pimatic.
*UPDATE 2017-12-08: A pimactic developer @rrooggiieerr on the pimatic forums has announced on 2017 December 1st, that he made a BLE plugin and a mi-flora plugin which work together and provide the same functionality as this tutorial’s method. As they are native pimatic plugins, it’s easier to set up the sensor that way, so I recommend you to use @rrooggiieerr’s plugins. Please disregard this tutorial, and read rrooggiieerr’s pimatic forum thread to get your sensors integrated into pimatic.
Before we proceed…
In the tutorial I will assume that you have set up your Raspberry Pi correctly, and can reach it either by SSH or directly using a display/keyboard. This tutorial doesn’t go into detail how to do the basic setup of a Raspberry Pi or the Raspbian Lite operating system which is getting the same IP address at every boot. I also will assume that you have pimatic up and running on your Pi3, there’s an excellent guide to get you started.
Necessary hardware
- Raspberry Pi 3 or Raspberry Pi Zero W
- Xiaomi MiFlora plant sensor
Other Raspberry Pi types like the Pi 1/Pi B+/Pi2/Pi Zero will not work out of the box, as they lack the onboard Bluetooth, but with the use of a Bluetooth dongle, you can make this work on any other type of Raspberry Pi.
Necessary Software
You need to install the Raspbian Lite OS to your Raspberry Pi.
- git and python3
- miflora library
Checking if the sensor works, using the Android app
MiFlora is using a CR2032 battery which is located under the protective panel. Open the panel of the MiFlora and pull out the plastic peg so the battery gets in contact and the sensor powers up (the LED at the top blinks a few times).

Install Flower care app on your Android (BLE enabled) phone. You can find the app on the Play Store.
Turn on Bluetooth and Location services (GPS!) on your phone. It’s strange, but enabling Bluetooth on my phone wasn’t enough, my phone couldn’t find the MiFlora with the Flower care app, only if location access (GPS) was enabled as well.
Start the Flower care app on your phone, and add the sensor using the + button. Hold the MiFlora close to the phone while it’s scanning. As soon as if finds the MiFlora, bind it. It offers to add a plant, do so. After this the MiFlora starts sending the plant’s data to your phone. Now, we know that the MiFlora sensor works. Now exit the app and disable Bluetooth so it won’t interfere with the Raspberry Pi 3 Bluetooth.
Note: When I first started my MiFlora, it was running firmware version 2.6.2, but Xiaomi continously works on improving the firmware, and the Flower care app sometimes offers to update the firmware to newer versions. Since I’ve written this tutorial, the firmware versions were: 2.6.2, 2.7, 2.8.6, 3.1.8. This tutorial is tested and works with all of the above Xiaomi MiFlora firmwares, and with the latest of openha’s MiFlora python3 code.
Getting data from a MiFlora sensor
Log into your Pi3 via SSH or locally with a display/keyboard.
Then let’s run apt-get update and apt-get upgrade to download the package lists from the repositories and update them, to get information on the newest versions of packages and their dependencies.
pi@pi0w-miflora:~ $ sudo apt-get update -y && sudo apt-get upgrade -y
...skipped output of the package updates...
The miflora script needs python3 to run, so we install it now:
pi@pi0w-miflora:~ $ sudo apt-get install python3
...skipped output of the package updates...
Bluetooth software is already a part of the raspbian-jessie-lite image, so we can just do a Bluetooth Low Energy scan to see if we find the MiFlora sensors. I have 2 sensors in range
pi@pi0w-miflora:~ $ sudo hcitool lescan
LE Scan ...
C4:7C:8D:61:57:A0 (unknown)
C4:7C:8D:61:57:A0 Flower care
C4:7C:8D:62:41:BE (unknown)
C4:7C:8D:62:41:BE Flower care
^C
You can only exit the scan by pressing Ctrl+C
If you’d like to start a scan which lasts 30 seconds, use the below command (we’re doing a reset of the hci0 bluetooth interface at the start, to avoid conflicts)
pi@pi3pimatic:~ $ sudo hciconfig hci0 reset; sudo timeout -s SIGINT 30s hcitool -i hci0 lescan
For some reason the blescan sees every MiFlora sensor twice (once as unknown, and once by it’s Bluetooth broadcast name).
What matters is now we know the MAC address of the MiFloras, let’s test one if we get any data. If we got only zeros using the next command, that would mean that there’s some issue in the communication or the sensor is faulty.
pi@pi0w-miflora:~ $ sudo gatttool --device=C4:7C:8D:61:57:A0 --char-read -a 0x35
Characteristic value/descriptor: aa bb cc dd ee ff 99 88 77 66 00 00 00 00 00 00
Seems like the sensor is OK!
Now we need to install git to be able to download Daniel’s miflora library from github, but for that we need git:
pi@pi0w-miflora:~ $ sudo apt-get install git -y
...ommitted package installation logs...
We can now download the miflora library:
pi@pi0w-miflora:~ $ git clone https://github.com/open-homeautomation/miflora.git
Cloning into 'miflora'...
remote: Counting objects: 256, done.
remote: Total 256 (delta 0), reused 0 (delta 0), pack-reused 256
Receiving objects: 100% (256/256), 88.61 KiB | 0 bytes/s, done.
Resolving deltas: 100% (119/119), done.
Checking connectivity... done.
Let’s change to the miflora folder, check the contents of it, and make demo.py executable:
pi@pi0w-miflora:~ $ cd miflora/
pi@pi0w-miflora:~/miflora $ ls
build.sh  demo.py  dist  LICENSE  miflora  README.rst  setup.py  test.sh
pi@pi0w-miflora:~/miflora $ chmod +x demo.py
Then try to run the script:
pi@pi0w-miflora:~/miflora $ /home/pi/miflora/demo.py --backend gatttool poll C4:7C:8D:61:57:A0
Getting data from Mi Flora
FW: 3.1.8
Name: Flower care
Temperature: 24.7
Moisture: 1
Light: 89
Conductivity: 0
Battery: 97
Yay, we got the data from the sensor! If you have more sensors like I do, just change the MAC address in the command. Repeat for every sensor you have.
Sending the sensor data to Pimatic
Now that we can fetch the data to the Pi3, we need to tell Pimatic to display them.
Plugins and configuration of pimatic
We need the pimatic-cron, pimatic-shell-execute, pimatic-log-reader plugins to be installed for this, so do that first.
It needs to look like this in the config, which is present here by default: /home/pi/pimatic-app/config.json
"plugins": [
    {
      "plugin": "cron"
    },
    {
      "plugin": "shell-execute",
      "active": true
    },
    {
	  "plugin": "log-reader",
      "active": true,
	  "debug": true
    }
  ]
pimatic Rules
We need to create the rule which will run the script every 10 minutes (there is no point to run it more freqently, as the MiFlora itself refreshes it’s data every 5 minutes only). The rule uses the cron plugin and the shell-execute plugin, and overwrites the contents of the “/home/pi/miflora/miflora-pimatic.log” file, so it will always contain only the latest data.
If ou only have 1 sensor
In the pimatic web GUI you can set it up like this:
When:
every 10 minutes
THEN:
execute "/home/pi/miflora/demo.py --backend gatttool poll C4:7C:8D:61:57:A0 > /home/pi/miflora/miflora-pimatic1.log"
make sure you have “Enabled” ticked in, and click Save
It will look like this in the config file:
"rules": [
    {
      "id": "poll-miflora",
      "name": "Poll MiFlora",
      "rule": "when every 10 minutes then execute \"/home/pi/miflora/demo.py --backend gatttool poll C4:7C:8D:61:57:A0 > /home/pi/miflora/miflora-pimatic1.log\"",
      "active": true,
      "logging": true
    }
  ]
If ou only have 2 sensors, like me
You can configure them very similarly, but you need to do a rule to poll the first Miflora every 10 minutes, and after 5 minutes of the polling of first sensor, it should poll the second sensor. This way we get a reading of both sensors every 10 minutes, but in perfect offset of 5 minutes from each other, thus not locking Bluetooth LE for one another.
IF:
every 10 minutes
THEN:
execute "/home/pi/miflora/demo.py --backend gatttool poll C4:7C:8D:61:57:A0 > /home/pi/miflora/miflora-pimatic1.log" and after 5 minutes execute "/home/pi/miflora/demo.py --backend gatttool poll C4:7C:8D:62:41:BE > /home/pi/miflora/miflora-pimatic2.log"
It will look like this in the config file:
"rules": [
    {
      "id": "poll-miflora",
      "name": "Poll MiFlora",
      "rule": "when every 10 minutes then execute \"/home/pi/miflora/demo.py --backend gatttool poll C4:7C:8D:61:57:A0 > /home/pi/miflora/miflora-pimatic1.log\" and after 5 minutes execute \"/home/pi/miflora/demo.py --backend gatttool poll C4:7C:8D:62:41:BE > /home/pi/miflora/miflora-pimatic2.log\"",
      "active": true,
      "logging": true
    }
  ]
LogWatcher
Then we will create a LogWatcher device which will keep an eye on the /home/pi/miflora/miflora-pimatic1.log file, and display the 5 important variables: Temperature, Moisture, Light, Conductivity, Battery.
The device config looks like this:
"devices": [
     {
      "file": "/home/pi/miflora/miflora-pimatic1.log",
      "attributes": [
        {
          "name": "Temperature",
          "type": "number",
          "unit": "°C"
        },
        {
          "name": "Moisture",
          "type": "number",
          "unit": "%"
        },
        {
          "name": "Light",
          "type": "number",
          "unit": "lux"
        },
        {
          "name": "Conductivity",
          "type": "number",
          "unit": "us/cm"
        },
        {
          "name": "Battery",
          "type": "number",
          "unit": "%"
        }
      ],
      "lines": [
        {
          "match": "Temperature: (.+)",
          "predicate": "miflora1.temperature",
          "Temperature": "$1"
        },
        {
          "match": "Moisture: (.+)",
          "predicate": "miflora1.moisture",
          "Moisture": "$1"
        },
        {
          "match": "Light: (.+)",
          "predicate": "miflora1.light",
          "Light": "$1"
        },
        {
          "match": "Conductivity: (.+)",
          "predicate": "miflora1.conductivity",
          "Conductivity": "$1"
        },
        {
          "match": "Battery: (.+)",
          "predicate": "miflora1.battery",
          "Battery": "$1"
        }
      ],
      "xAttributeOptions": [],
      "id": "miflora1",
      "name": "MiFlora 1 Sensor",
      "class": "LogWatcher"
    }
]
The LogWatcher device will then update the data on the Pimatic frontend.
For two sensors it absolutely the same, we just add the watching of another file, like this. Please note that the filename is miflora-pimatic2.log, the predicates contain miflora2.xyz variable and the device id is miflora2
{
      "file": "/home/pi/miflora/miflora-pimatic2.log",
      "attributes": [
        {
          "name": "Temperature",
          "type": "number",
          "unit": "°C"
        },
        {
          "name": "Moisture",
          "type": "number",
          "unit": "%"
        },
        {
          "name": "Light",
          "type": "number",
          "unit": "lux"
        },
        {
          "name": "Conductivity",
          "type": "number",
          "unit": "uS/cm"
        },
        {
          "name": "Battery",
          "type": "number",
          "unit": "%"
        }
      ],
      "lines": [
        {
          "match": "Temperature: (.+)",
          "predicate": "miflora2.temperature",
          "Temperature": "$1"
        },
        {
          "match": "Moisture: (.+)",
          "predicate": "miflora2.moisture",
          "Moisture": "$1"
        },
        {
          "match": "Light: (.+)",
          "predicate": "miflora2.light",
          "Light": "$1"
        },
        {
          "match": "Conductivity: (.+)",
          "predicate": "miflora2.conductivity",
          "Conductivity": "$1"
        },
        {
          "match": "Battery: (.+)",
          "predicate": "miflora2.battery",
          "Battery": "$1"
        }
      ],
      "xAttributeOptions": [],
      "id": "miflora2",
      "name": "MiFlora 2 Sensor",
      "class": "LogWatcher"
    },
The sensor will look like this in the pimatic dashboard:
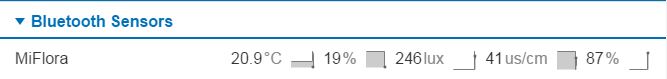
Placing the sensor
You need to stick the sensor into the soil of the plant you wish to monitor (the soil level must be at the point where the prongs of the sensor split into two).
There is an ongoing discussion on the pimatic forums about the MiFlora sensor, please feel free to join and comment if you’ve liked this tutorial.
That is all!
All images are a courtesy of Xiaomi or my own screenshots.
This tutorial was revised for changes on: 2017-12-08
It was tested with the below software versions:
Raspbian OS image: 2017-04-10-raspbian-jessie-lite
pi@pi3pimatic:~ $ grep version /home/pi/pimatic-app/pimatic-daemon.log | tail -1
04:59:52.399 [pimatic] info: Starting pimatic version 0.9.42
pi@pi3pimatic:~ $ node --version
v4.6.2
miflora library: miflora-0.2.0 (released 2017-02-06)
MiFlora sensor firmware tested: 2.9.2, 3.1.8